There is a new agent that will be replacing the Microsoft Monitoring agent that we all know from Azure Sentinel. It is called the Azure Monitor Agent and you can think of it more of a new system to ingest data rather than an upgrade from the current system.
To get a better idea of how it works, read this page but here are some of the highlights:
- Replaces the Log Analytics Agent (AKA the Microsoft Monitor agent), Diagnostic extension, and the Telegraf agent (used only on Linux systems).
- You can set the scope of what you want to monitor. This means that you are not stuck with a one-size-fits-all solution when it comes to ingesting log data. You can set-up different data collection rules so that different VMs ingest different data! More on this later in the posting.
- Windows event filtering. You can use XPATH queries to filter which Windows events are collected BEFORE it gets ingested, saving you ingestion charges. This works in conjunction with setting a scope in the previous bullet point.
- Improved extension management so it is more manageable to add extensions also making it easier to debug which one is causing issues.
How can I setup the scopes that I want to use? You can read the instructions on this page but here is the short version.
- Go to the Monitor page in the Azure Portal and then select “Data Collection Rules”
- Click “Add” in the header bar to add a new data collection rule.
- You will be take to the page shown below. Fill in the blanks as needed.
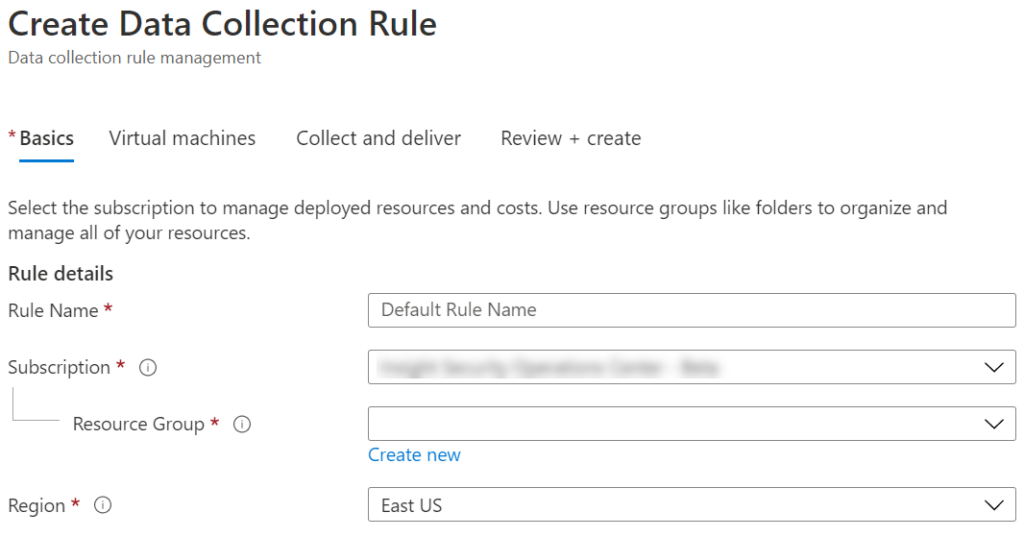
You may have noticed that you can setup different resource groups for the various rules. Personally, I would recommend keeping all these rules in one resource group to make it easier to manage.
Click the “Virtual machines” tab.
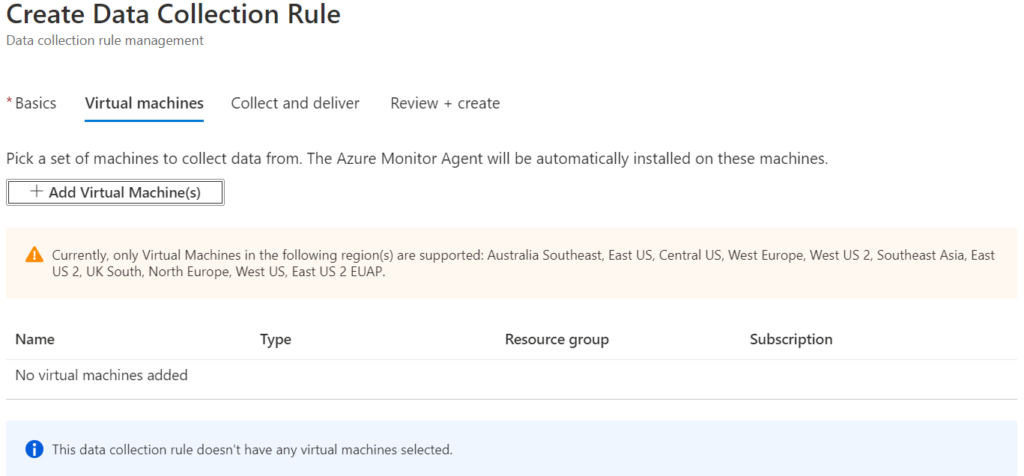
4. This is where you can add the different VMs upon which you want this rule to be applied. As seen in the image below, this is currently restricted to a few different regions but that will be expanding all the time.
One thing that is a bit annoying is this is not a dynamic list in any way. You have to select the VMs you want manually. It has been asked for some sort of dynamic allocation, perhaps using tags, but no clue if that will ever happen.
5. Once you have the VMs selected, go to the “Collect and deliver” tab. This is where you select what you want to collect and where you want to send the data.
The screenshot below shows the tab after clicking on the “+ Add data” source button and after selecting “Windows event logs” from the “Data source type” drop down list.
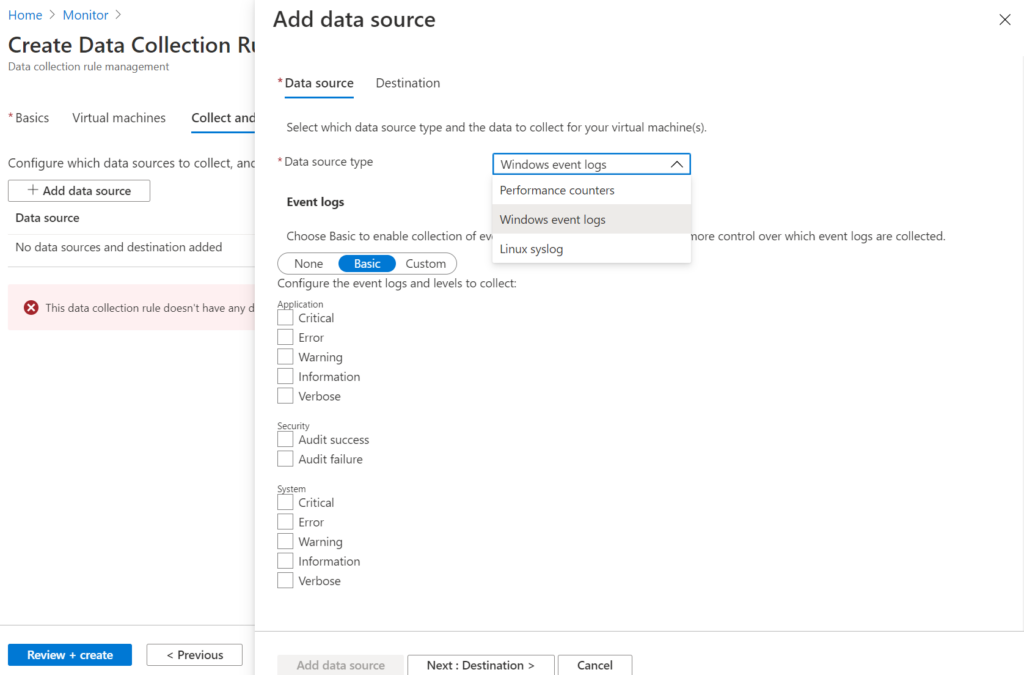
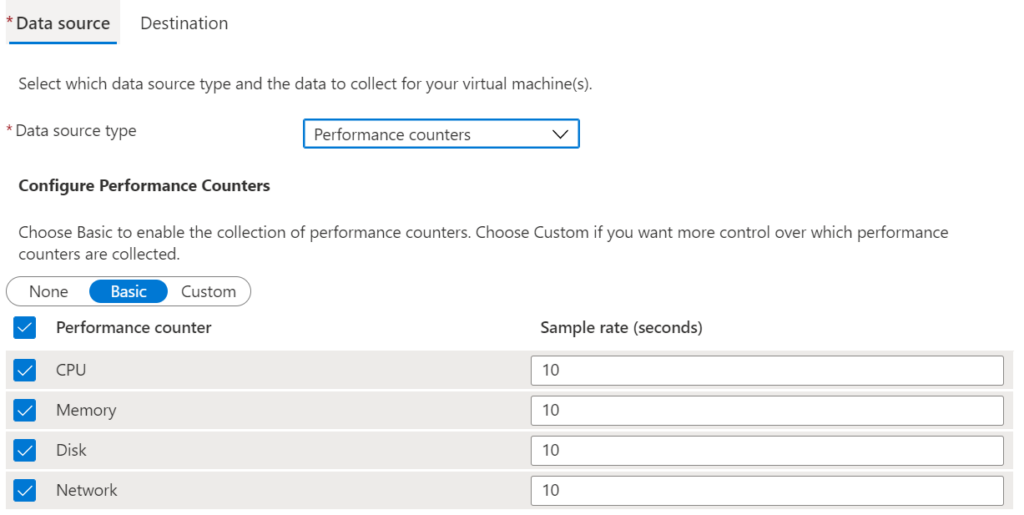
As you can see, the drop down list also allows you to select “Performance counters” and “Linux syslog”. The Performance counter looks like the following. You can uncheck any of the performance counters you do not want.
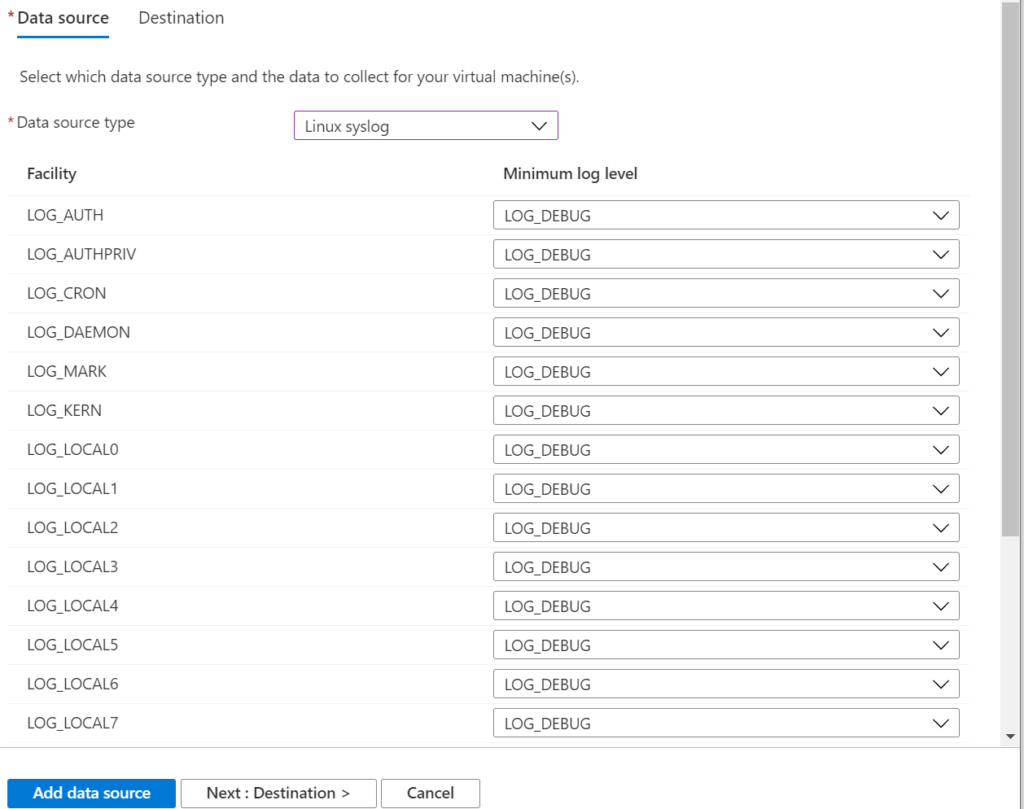
The Linux syslog looks like the following. Note that you can switch the Minimum log level to “none” if you do not want this facility ingested.
So what if you need a different Performance counter or different Windows event logs? That is where the XPATH queries come into play. For this example, I have selected the Windows events as follows
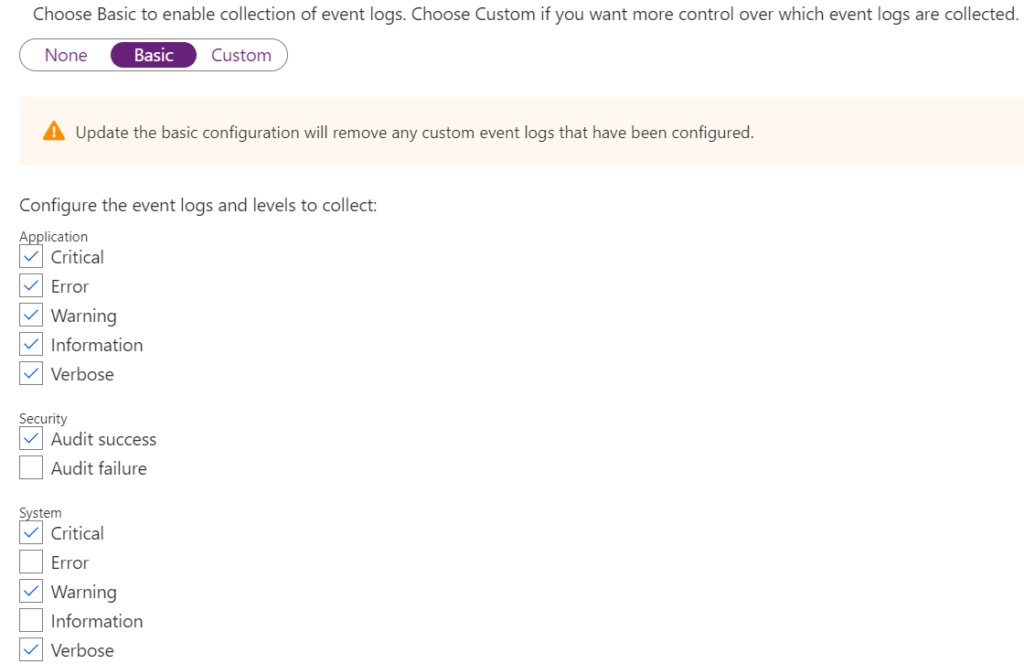
If I then switch the selector to “Custom” I see the following page

This is where you can write your XPATH queries to get the information you need. If you do not know XPATH, there is a tutorial on this page. Microsoft has also provided a sample on this page. You can enter the XPATH query and then click the “Add” button to add the new query.
Once you have all the information you want setup to be ingested, select the “Destination” tab to select the Log Analytics workspace that will receive the data and click on the “Add data source” button at the bottom of the page to add this data source.
6. Click on the “Review + create” tab to make sure everything is setup correctly and then click the Create button to create your new rule.
Warning: This is probably only during the public preview but I found that if I delete a VM that has a rule applied to it, I am no longer able to delete the rule. It will throw an error message about the VM not existing. Hopefully this will be fixed in the near future.
Update: This warning is no longer valid and has been resolved by Microsoft 🙂
Summary: The Azure Monitor agent is going to replace the current Microsoft Monitoring agent that is being used with Azure Sentinel. It will have many benefits including being able to scope what data each VM will send to the Log Analytics workspace. It is currently in public preview but once it is GA’d I am sure Microsoft will require an update pretty quickly so be ready.