I was playing around with workbooks and noticed that there is a new preview Data Source called Azure Resource Manager. When I selected it I noticed that the Path it wanted begins with /subscription so I thought I would try it with the URL to get Incidents from Sentinel.
Lo and behold it worked! It did take a little massaging to get the data into a somewhat usable form and there are a few caveats:
- This is a preview Data Source so there is no guarantee that it will stick around or even work the same at any given time
- That data that comes back is in JSON format so there isn’t a lot of formatting you can do.
- It appears that you can only see the output in the Grid view. Any of the graphical views I used tried to use the Incident number so the results were not valid.
So with that being said, let’s get to it. I am not going to go into detail on how to get a Workbook running since it is all in a book I am writing (details forthcoming) so you will need to know how to work with Workbooks before starting this.
Step 1: Get the needed URL
You can go back to my blog called Your first Azure Sentinel REST API call for information on how to get and format the URL needed. I am going to use the same URL to get Incidents as I did there
/subscriptions/{subscriptionId}/resourceGroups/{resourceGroupName}/providers/{operationalInsightsResourceProvider}/workspaces/{workspaceName}/providers/Microsoft.SecurityInsights/cases?api-version=2019-01-01-preview
Making all the needed substitutions in the URL as needed.
Step 2: Add a new Query step to the workbook
While you are editing a workbook, click on the Add query link at the bottom of the page as shown below

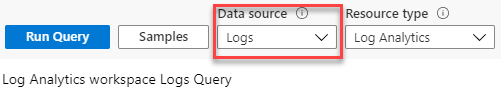
This will add a new query step to the workbook as shown below. Note that the Data Source is Logs
Click on the Data source drop down and select Azure Resource Manager (preview). The screen will change as shown below
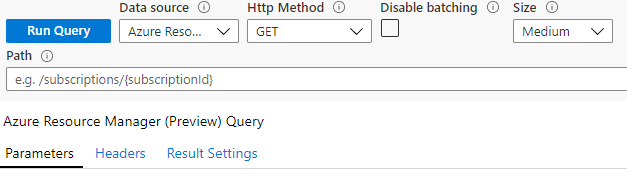
Enter the query from Step 1 and click Run Query. You will see the JSON being returned. However this is not very useful.
Step 3: Changing the results
If you look at the image above, at the bottom is a Result Settings tab. Click that and there will be two options as shown below.

Select the JSON Path option. There will be a new field under the options to enter a JSON Path. If you are not familiar with JSON paths, this URL can help: http://jsonpath.com/
In this field we are going to enter
$.value[*].properties
Which means, taking into all the data that was sent back, look at the value object and for each object under that, return that object’s properties values.
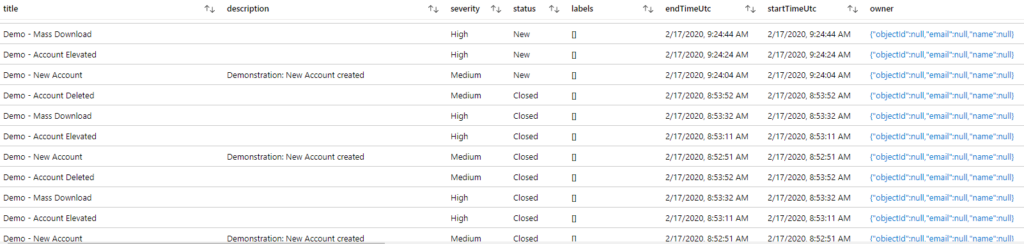
Click on the Run Query button again to see the changes. A bit more readable? It should look similar to the image below
Step 4: Formatting the table
While there isn’t a lot you can do to change the way the table looks, mainly due to the lack of formatting options with the results, you can do things like hide fields you may not want to see, like owner, change the title of the column headings, and grouping the data.
Click the Column Settings button at the header of the step. This will open the Column settings pane as shown below.
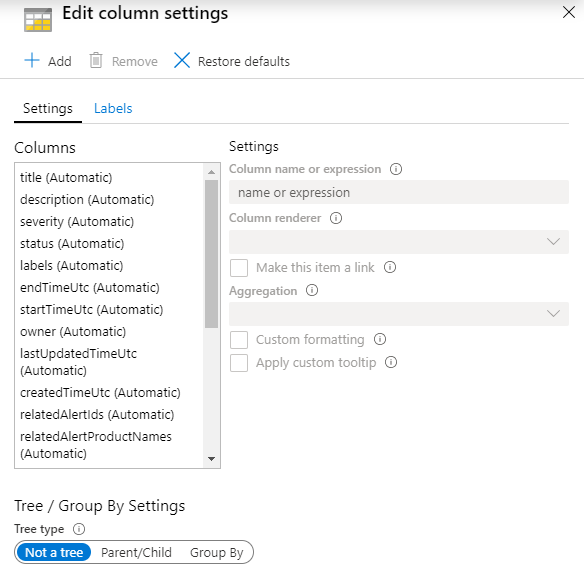
For each of the columns listed, use the Column renderer drop down and select Hidden for those columns you don’t want to see. You can also switch to the Labels tab and enter in new headings for the columns.
Finally you can change the Tree Type to Group By and group the rows if you wish.
Summary
There you go, a quick (and fairly dirty) way of viewing your incidents in a workbook. Not quite how I want to see them but at least it is a start. Hopefully Microsoft will release a way to be able to manipulate the data so we can make better charts and graphs.