Introduction
Second Edit: Look at the entry Ingesting Azure Sentinel Incident information into Log Analytics Part II for more updates
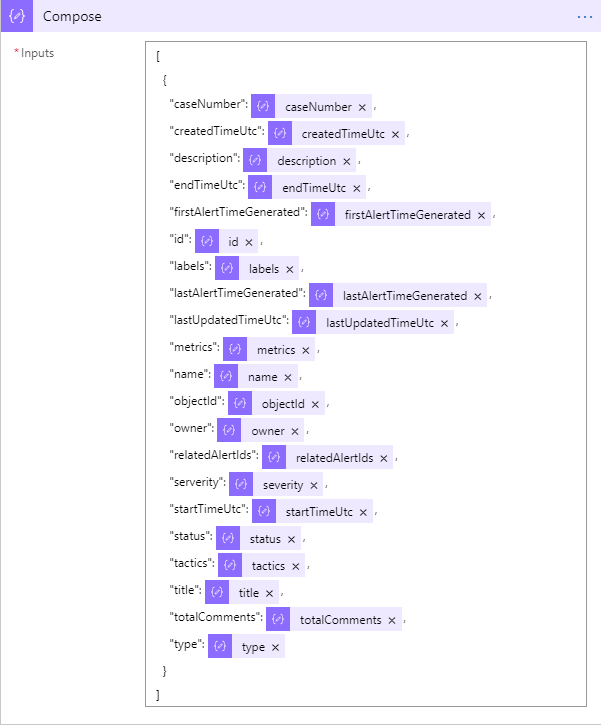
Edit: I forgot to add the image for the Compose section. Also, there is a typo in it. I have serverity when it should be severity (or whatever else you want to call it). If you change it after you have already run this, you will end up with both the serverity and the severity columns so it may be better to just rename it in the query.
One of the questions I see over and over is how to access Incident information inside Azure Sentinel Logs. Sadly, the Incident information is not stored in Log Analytics (probably due to Log Analytics being read-only and Incidents can be updated).
After reading some other posts including Creating digital tripwires with custom threat intelligence feeds for Azure Sentinel and Protecting your Teams with Azure Sentinel, I realized that the steps listed in these articles could be used to ingest the Azure Sentinel Incidents as well.
Setup
This solution will use Logic Apps to gather the information. Before we start writing the Logic App there are a two other Azure resources that need to be setup.
Register an App
In order to register an App follow these steps
- Inside of Azure AD, click on App Registrations link in the left-hand navigation bar
- Select New Registration
- Enter a name for the App. Make is descriptive enough so that anyone else looking at it will know what it is for.
- Leave all the other parameters alone and click the Register button to create the new app.
- Click on the Certificates and Secrets link in the left-hand navigation bar
- Click New Client Secret
- Enter a new name for the secret and set the Expires field to never
- Click Add to add the new secret
- When the new secret is displayed copy it and store it! You will not be able to see this secret again.
- You will also want to copy the Client ID for this App since you will need it later.
The Protecting your Teams with Azure Sentinel blog post has a nice gif that shows all the steps you need to take to perform these tasks.
One additional step you will need to take is to give this App the Azure Sentinel Reader rights at the some level. You can use either the Subscription, Resource Group, or Log Analytics workspace level and I would recommend the Log Analytics workspace level just for added security.
Create a Storage Account
You will need a place to store a file that holds the last time the Logic App was run. This example will use a file stored in an Azure Blob (AKA Containers) since Logic Apps have actions that make it easy to work with this type of file.
The Creating digital tripwires with custom threat intelligence feeds for Azure Sentinel blog post has instructions on how to set this up so I won’t repeat it here. The only difference is I made my container private it and it works quite well.
Once your Storage Account and Container have been created, you need to create a new file that will store the last time the Logic App ran. It does not matter what you call it as long as you remember what it is. I called mine LastRunTime.txt Add one line to the file and enter
2000-01-01T00:00:00.000Z
into it. Save this file and upload it to your container. I have found that using the Microsoft Azure Storage Explorer program to be quite handy for this. We use a very old date to make sure we get all the information to start with.
Logic App
Overview
Now that we have the preliminary steps done, we can start working on the Logic App itself. This Logic App will run on a recurrence timer that will
- Get the last run date/time from the file
- Call the REST API to get any Incident that have changed since that time
- Update the last run date/time in the file
- Parse the JSON (to get rid of the value entry
- For each of the Incidents returned do either
- Create the new Log Analytics entry using the JSON returned
- Parse the JSON again and create the new Log Analytics entry using your own column names
When complete, the Logic App will look like this image.
The red arrow at the bottom just means that the second For each will only get execute if the first one fails. I did this to show the two different options for Step 5 above. You will only have one or the other For each loops.
Creating the Logic App
First, create the Logic App. Again, I am not going to walk you through the steps needed to do that. You can follow this link to learn how to create a new Logic App if you do not know how: https://docs.microsoft.com/en-us/azure/logic-apps/quickstart-create-first-logic-app-workflow. Once the Logic App has been created you can use the Blank Logic App template to create an empty Logic App
Trigger
Find the Schedule connector, select it, and then select the Recurrence trigger The actual interval to use it up to you. You could run this very frequently to use this as a change log (although you cannot tell who made the changes) but you will have to pay each time it runs and it will only be around for as long as the log retention. If you want to do this you should consider changing the retention for the log you will be creating. This link has more information on how to do that: https://docs.microsoft.com/en-us/azure/azure-monitor/platform/manage-cost-storage#retention-by-data-type
Get blob content
The Azure Storage Blob connection has the Get blob content action. Add that to your Logic App and it will look like the image below. The first time it is added it will show the listing of all the accounts. After that it will use the selected one.
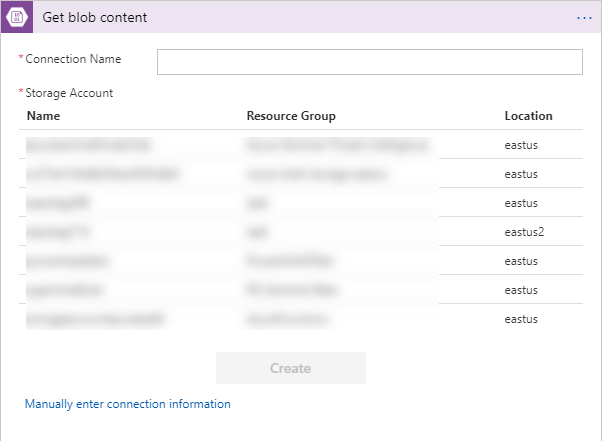
Add a connection name and then select the storage account you created in the steps above. The connector will change to look like the image below.
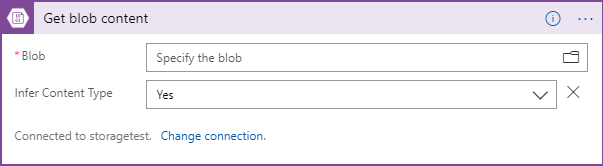
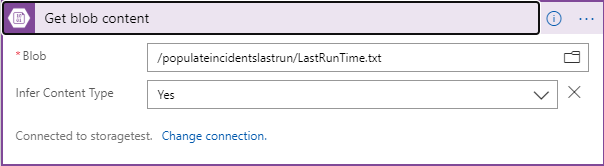
Click on the folder icon to the right of the Specify the blob text box and follow the path until you find the file you created above. The textbox will be filled in with the path to the file as shown below.
HTTP
Next find and select the HTTP connector and the HTTP action and it will look like the image below:
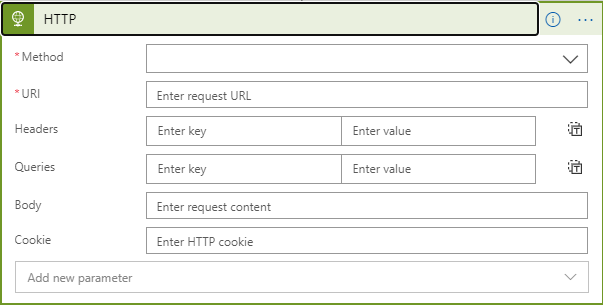
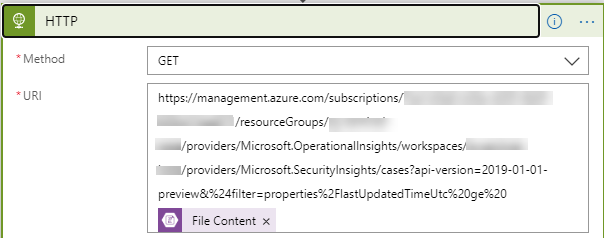
To fill it out, set the Method to GET. Next we need to fill in the URI. Refer back to my post called Your first Azure Sentinel REST API call to see how to format the URI. We will be using the incidents call so the URI will look like:
https://management.azure.com/subscriptions/{subscriptionId}/resourceGroups/{resourceGroupName}/providers/{operationalInsightsResourceProvider}/workspaces/{workspaceName}/providers/Microsoft.SecurityInsights/incidents?api-version=2019-01-01-preview
So, now we are closer. We need to make the substitutions for those words in the braces, like {subscriptionId}. Most should be easy enough to figure out: The subscription GUID for subscriptionId, the name of the resource group where you Log Analytics workspace resides for the resourceGroupName, and the name of the Log Analytics workspace for the workspaceName.
That leaves the “operationalInsightsResourceProvider”. What is this? Once again, we are dealing with Microsoft legacy names. Log Analytics used to be called Operational Insights so that is just the name of the Log Analytics provider which, in all cases unless told otherwise, will be “Microsoft.OperationalInsights”
The last thing we need to add is the filter to make sure we only get the new Incidents. This took a little bit of trial and error but I finally figured out that we will need to add the text below to the end of the URI:
&%24filter=properties%2FlastUpdatedTimeUtc%20ge%20
This will filter the results to use the lastUpdatedTimeUtc column under the properties column to only those whose value is greater than or equal to whatever we add to end of this line.
Since we already have that information in a file, we can use the Get blob content’s File Content in the Dynamic content window. To do this just click in the URI window and paste the URI that we have created. The Dynamic content window will open and the only thing that should be showing is the File Content. Click it to add that value. Once done the URI should look like the image below:
In the Headers section add Content-Type as new Key and application/json as the value.
At the bottom of the connector, click on the Add new parameter drop down and select Authentication as shown below:
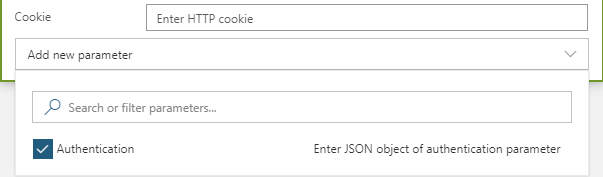
Click anywhere outside of the drop down and when the Authentication type drop down is shown select Active Directory Oauth. The screen will change to look like the one below:
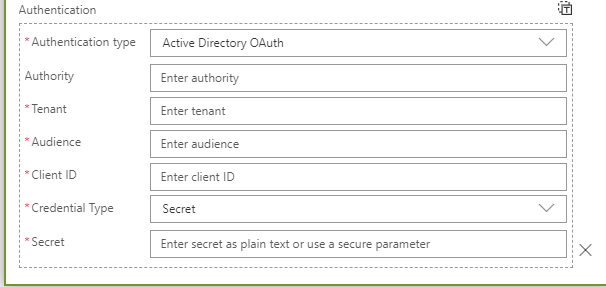
Fill in the following values:
| Name | Value |
| Tentant | Your Tenant ID. You can get this from the overview page of your Azure Active Directory screen. |
| Audience | https://management.azure.com |
| Client ID | The Client ID from the App you created above |
| Credential Type | Select Secret from the drop down if it is not already selected |
| Secret | The Secret from the App you created above |
This can now go out and gather your incidents.
Note: This call will only return 200 incidents. If you have more than that, there will be a nextLink value returned along with the value. You can call the URI that is returned in the nextLink value to get more incidents. I have not done that here but you could use the Until action of the Control controller to recursively call this to get all the data if you need to.
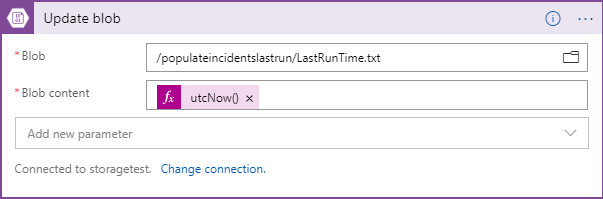
Update blob
Now that we have made the call, we need to update our file with the last date and time that we made the call to get the Incidents. Logic Apps makes this very easy.
Search for Azure Blob Storage, select it and then select the Update blob action. It will look like the image below:
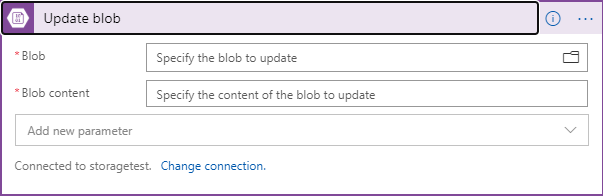
Click on the folder icon to the right of the Specify the blob to update textbox and find the file that you use to store your last run date and time.
Click in the Specify the content of the blob to update textbox and in the window that pops-up select the Expression tab. Scroll down until you find the utcNow() function. Select it and then click on the OK button.
When you are done it should look like this image:
Parse JSON
Now that we have our data being returned in JSON format, we need to modify it so that we can use it. The data being returned has a top level value property and each incident is listed as a property in an array below it. Optionally, there will be nextLink property as well (see the note box above).
We will use the Parse JSON action to get to the information we need. Do a search for Data Operations, select it, and then select the Parse JSON action. It will look like the image below:
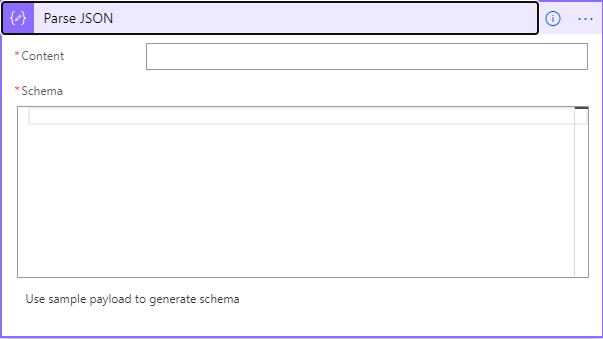
Click in the Content textbox and in the Dynamic Content window, scroll down until you see the HTTP grouping and select the Body entry.
In the Schema textbox enter:
{
    "properties": {
        "value": {
            "items": {
                "properties": {},
                "required": [],
                "type": "object"
            },
            "type": "array"
        }
    },
    "type": "object"
}
I will admit that I cheated a bit and originally had the output of the HTTP call get posted to my Teams site so I could see it. I then used the Use sample payload to generate schema link to get this created.
So this will return an array of all the Incidents in JSON format. Here is where you need to make a decision.
You can do the quick and easy route of just using the data as it to create the entry in the custom log. This works quite well but you end up with column names like properties_closeReason_s and properties_description_s. You could use the extend or project command to rename these and create a function that does it automatically. If that works for you then use the next steps. If you want to have more, but unfortunately not complete, control over the names skip the next section and go to the one following it.
Using data as is
If you are satisfied with the default names that get created then all you will need to do is to add a For Each loop and a Send Data action to populate your custom log.
First search for and select the Control controller and then select the For each action. It will look like the following image:
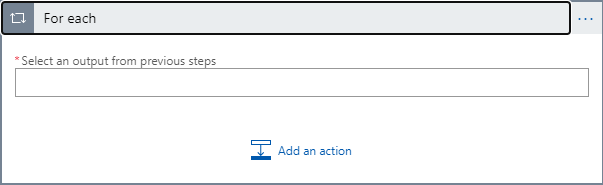
Click in the Select an output from previous steps textbox and in the Parse JSON section select the Body entry. You may need to click on the See more link to actually see this entry. The control will now look like:
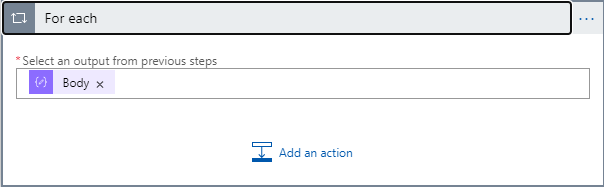
Click on the Add an action link and search for and select the Azure Log Analytics Data Collector connector and then select the Send Data (preview) action. The For each step will now look like:
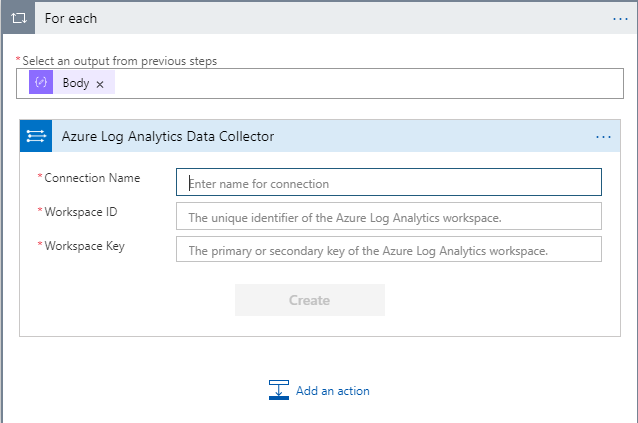
Enter a good connection name. Also enter your Workspace ID and Workspace Key that you can get from the Log Analytics, Advanced Settings link. It does not matter if you use the Primary or Secondary key. Once that information has been entered, click on the Create button to create your connection. The connector will now look like:
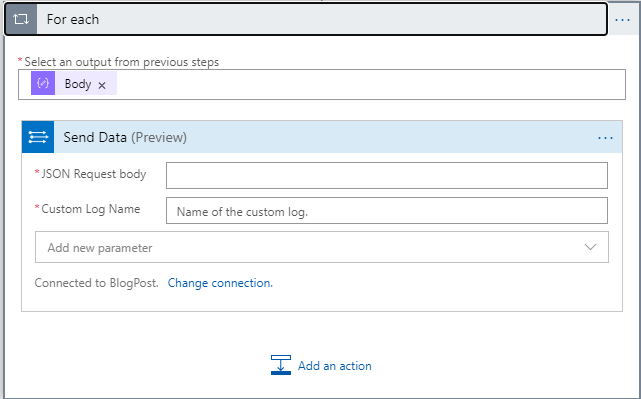
Click on the JSON Request body textbox and in the Dynamic Content pop-up window, under the For each section select the Current item. In the Custom Log Name textbox enter the name of the log you want to be created. Note that the log will automatically have “_CL” appended to the name.
You are now done! After you run this it may take a while for the data to show up in your logs.
Creating your own column names
This is just slightly different than the other section. You can use the instructions above to add the For each action. However instead of adding the Send Data action you will add another Parse JSON action.
In this new Parse JSON action, click in the Content text box and in the Dynamic Content pop-up window, under the For each section select the Current item.
For the Schema, enter the following (I cheated again)
{
    "properties": {
        "etag": {
            "type": "string"
        },
        "id": {
            "type": "string"
        },
        "name": {
            "type": "string"
        },
        "properties": {
            "properties": {
                "caseNumber": {
                    "type": "integer"
                },
                "createdTimeUtc": {
                    "type": "string"
                },
                "description": {
                    "type": "string"
                },
                "endTimeUtc": {
                    "type": "string"
                },
                "firstAlertTimeGenerated": {
                    "type": "string"
                },
                "labels": {
                    "type": "array"
                },
                "lastAlertTimeGenerated": {
                    "type": "string"
                },
                "lastUpdatedTimeUtc": {
                    "type": "string"
                },
                "metrics": {
                    "properties": {
                        "SecurityAlert": {
                            "type": "integer"
                        }
                    },
                    "type": "object"
                },
                "owner": {
                    "properties": {
                        "email": {},
                        "name": {},
                        "objectId": {}
                    },
                    "type": "object"
                },
                "relatedAlertIds": {
                    "items": {
                        "type": "string"
                    },
                    "type": "array"
                },
                "relatedAlertProductNames": {
                    "items": {
                        "type": "string"
                    },
                    "type": "array"
                },
                "severity": {
                    "type": "string"
                },
                "startTimeUtc": {
                    "type": "string"
                },
                "status": {
                    "type": "string"
                },
                "tactics": {
                    "items": {
                        "type": "string"
                    },
                    "type": "array"
                },
                "title": {
                    "type": "string"
                },
                "totalComments": {
                    "type": "integer"
                }
            },
            "type": "object"
        },
        "type": {
            "type": "string"
        }
    },
    "type": "object"
}
Now we will be able to have all the individual items from the JSON as variables in the Logic App. Next we need to recreate this JSON using our own column names.
Search for and select the Data Operations connector and then the Compose action. Once added it will look like the image below:
We will use this to create the JSON. Rather than going through each step, I am going to show you what mine looked like when completed. You can call your columns whatever you want just remember that the column name in the log will be appended with an underscore and the data type. So even though I say I want a column called description it will actually be description_s (for string). Annoying and I really have no idea why it is done this way.
Finally we need to send the data into the log. Use the instructions above to add the Send Data (preview) action but when you click in JSON Request Body, in the Dynamic content window find the Compose group and select Outputs.
That is it!
Summary
There you go! You can now have your incidents in a custom log where you perform all those wonderful KQL queries!
There are definitely places you can improve on this process including:
- Getting all the incidents as mentioned earlier
- Using this same flow to the incident’s entities and bookmarks