Introduction
I have been asked quite a bit which API does Microsoft Sentinel do to perform X? That is usually followed up with how did I determine that?
The answer to that question is very simple. I have delved into my previous life as a developer and used a tool that was incredibly useful when I worked with SharePoint. Namely the Edge browser’s Developer tools. Which is also the same tool that is available in Chrome (which makes sense since they both use the same engine). I am sure other browsers have a similar tool but I don’t use other browsers so I cannot be certain.
Introduction to Developer tools
This is an incredible tool that is built-into Edge. It allows you to perform many different actions. When I worked with SharePoint, I used to use it to view the elements on a page to figure out how to override the default page design using some JavaScript and CSS.
We cannot do that with Microsoft Sentinel (as much as I would like to at times), but it also has a network tracer that I use to determine which APIs are being called.
There are three different ways to open the Developers tools:
- Use the context menu at the right-hand side of your browser window, go down to “More tools” and then select “Developer tools”
- Press Ctrl-Shift-I
- Press F12. This used to be the key shortcut before it got remapped to Ctrl-Shift-I. If you press F12 the first time, you will be asked if you want to map this to the Developer tool or not.
When you start the Developer tools for the first time, it will look like the image below. Note that Develop tool opens alongside the current page so having a widescreen monitor is very beneficial. The actual HTML will be different. In this case I am loading the Incidents page in Microsoft Sentinel. It is worth noting that the Developer tools will only work for the tab that started it in the browser.
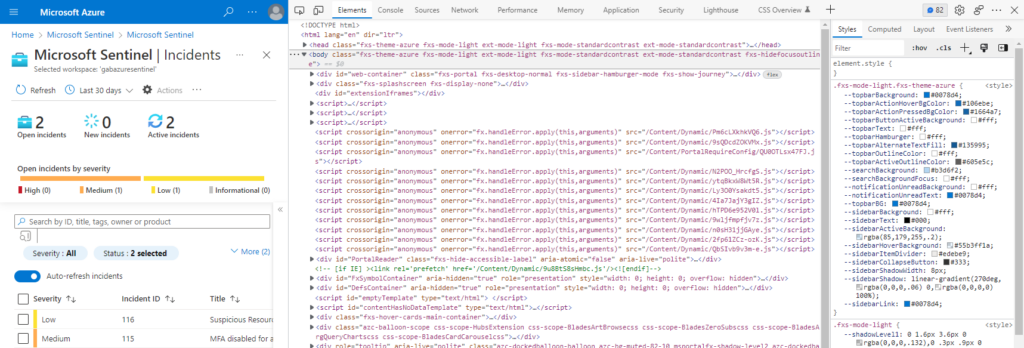
If you look at the header bar, you can see that “Elements” is the currently selected tab. This will show you the HTML for the current page, and on the right side it will show you all the styles for the selected line. You can also use the button on the left that looks like an arrow pointing into a box to select a specific element from the page. The button to the right allows you to mimic different devices to see how your page would look using a different device. Pretty powerful.
The tab that we are interested in for this post is the “Network” tab. This will show you all the network traffic that has been generated since you started monitoring.
Monitor network traffic
When you switch to the network tab, it will look something like the image below:
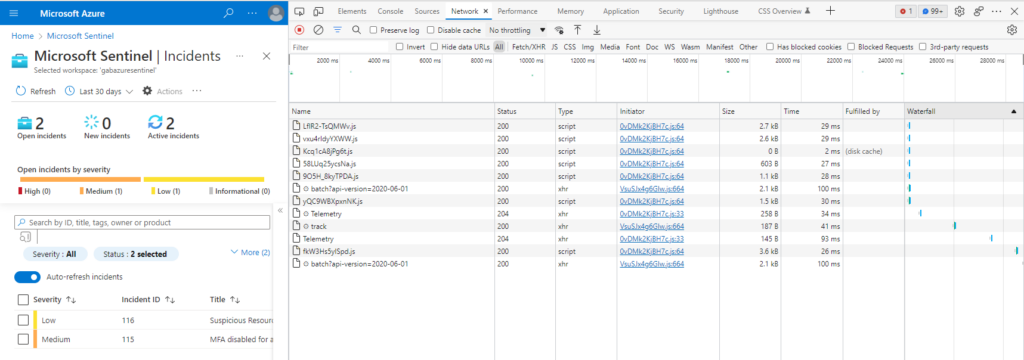
This is showing all the network traffic that has occurred since you started monitoring the traffic. It can be very powerful.
Let’s take a look at the header bar for network traffic:

The icon on the far left will start/stop monitoring. Once you get a good trace, you will want to stop monitoring so you can look at the information without more data popping onto your screen
The icon to the right of that will clear out all the recorded data. This helps you get a nice clean run.
The next icon (the 3 horizontal lines in a revers pyramid) allows you to filter the data to see just what you want.
The magnifying glass icon allows you to search for a specific term either in the request or results. This is useful if you know what you want to find but don’t want to dig through all the data.
If the “Preserve log” checkbox is checked, the data will keep between refreshes or page navigation
The “Disable cache” checkbox will force the page to always load all the data, ignoring the cache, if checked.
The throttling dropdown will allow you to mimic different network types including different 3G networks as well as the ability to create your own throttling scheme.
The next button allows you to set more network conditions
The last two buttons (the up and the down arrows) will allow you to upload or download a HAR file. You can download the file for further investigation in other tools
If you select a row in the network section, it will look like the image below:
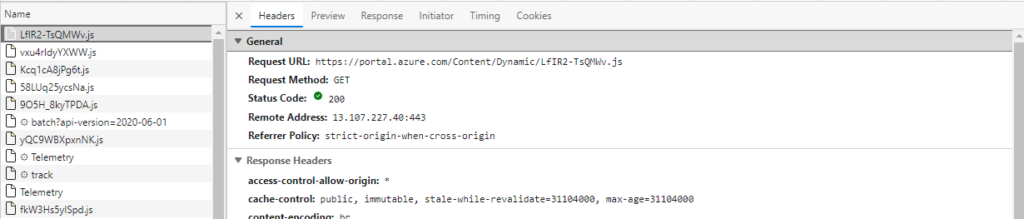
We are not going to go into this into much detail. Just note that you can see the data that was sent and what was retrieved.
How to find the Microsoft Sentinel APIs
Now that we know how to use the tool, how do we find the actual APIs?
If we look at the network traffic that was sent when I reloaded the Incidents page, nothing really jumps out
The only thing that even mentions APIs is the “batch?api-version=2020-06-01”. It turns out that is what we need to look at.
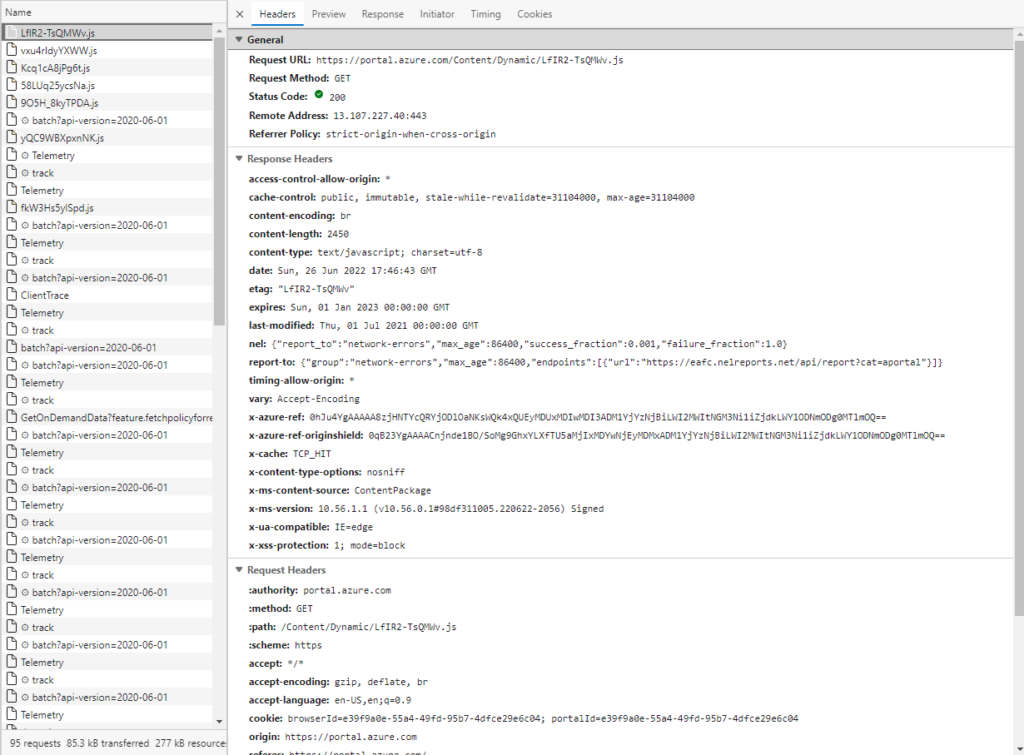
This call is an API call that Microsoft created that allows for multiple APIs calls to be made at one time! If I select one entry, it looks like:
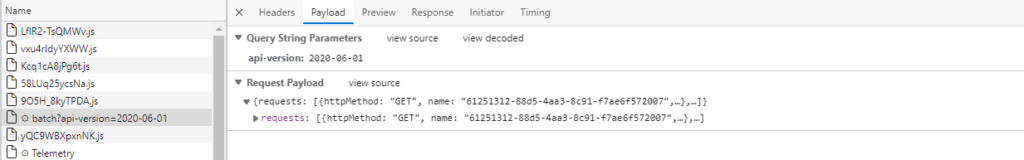
Not a lot of useful information there. To get to the actual APIs being called, we need to expand the “requests” section on the right side of the screen.
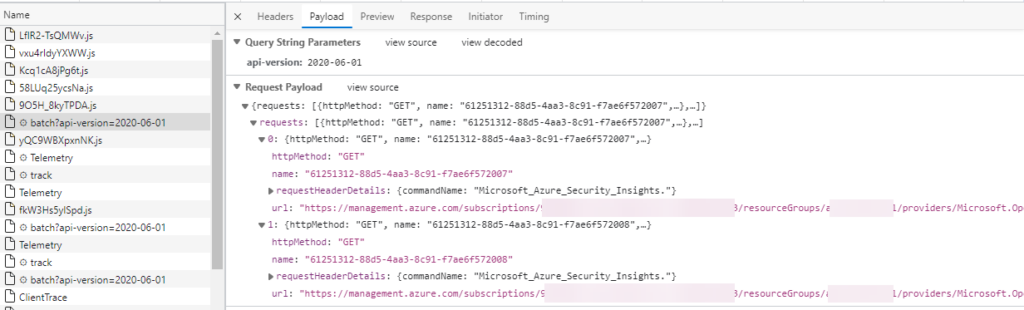
You see those “url” entries? Those entries look familiar don’t they. Don’t worry, there is a scroll bar so you can scroll to the right to see the entire entry. You can also right-click on the line to be able to copy the value.
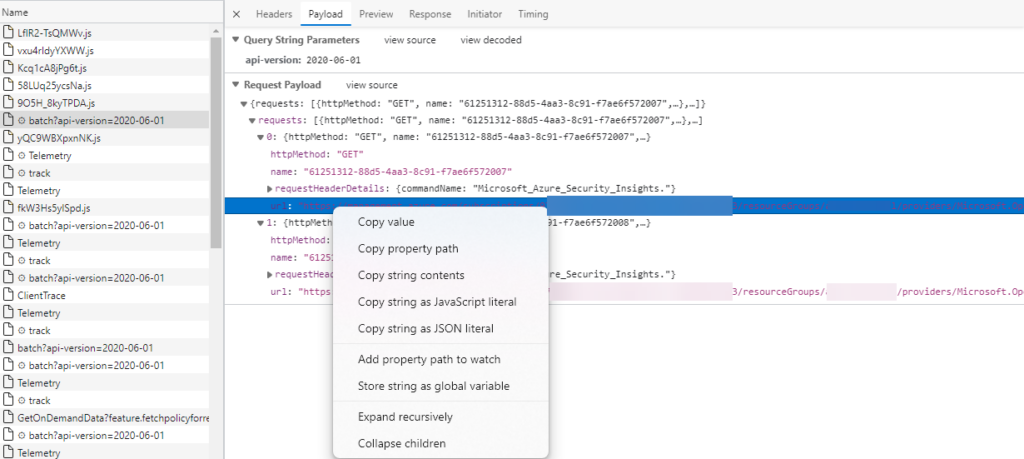
BTW, the “Expand recursively”, when run from the very top, will expand everything, making it easier to see all the information.
Summary
This blog post explained how to determine what APIs Microsoft Sentinel uses to do its magic. This can be used in any page really, it is not limited to just Microsoft Sentinel. Hope it helps!
One thought on “How do I determine what API Microsoft Sentinel is using?”
-
Pingback: Extract Microsoft Sentinel MITRE information to CSV file – Yet Another Security Blog
Leave a Reply